In today's business landscape, extracting valuable insights from your data is a must-have ability. Secrets or magic tricks play no role here — just the mastery of data analytics tools like Tableau.
Gone are the days of relying on gut feelings when it comes to strategic decision-making in business. These days, organizations understand that data is the key to unlocking growth and staying ahead in a rapidly evolving market.
Tableau, with its robust suite of features, enables professionals from a range of backgrounds to dive headfirst into the realm of data analytics. Whether you’re a seasoned data scientist or a company executive eager to make informed decisions, Tableau analytics equips you with the tools to visualize, analyze, and derive meaningful insights from your data.
In this article, we’ll give you everything you need to know —- from the fundamental essence of Tableau to its extensive array of features and benefits. We’ll also delve into its business applications and show how it empowers businesses to make data-driven decisions.
Let’s get started!
What is Tableau data analytics?
Tableau is a data analytics and visualization tool that allows organizations to connect to data sources, import and blend data, and create interactive dashboards, reports, and charts. This helps users to better understand and interpret massive amounts of data and make more informed, data-driven decisions.
Tableau was cofounded in 2003 by Chris Stolte (a PhD candidate at Stanford), Professor Pat Hanrahan, and Christian Chabot (who was in the room at Chris’ dissertation defense that year). The company’s mission was to create a tool that would simplify data analysis and make it more accessible to a broader audience, even to those without a tech background. The product quickly gained popularity for its innovative approach to data visualization service.
In 2019, the Tableau data analytics platform was bought by Salesforce. This acquisition further enhanced Tableau’s capabilities by integrating it with Salesforce’s extensive suite of CRM tools.
Today, Tableau visual analytics is widely recognized as one of the leading data analytics and visualization platforms and is used by numerous organizations across industries.
Would you like to receive consultation from IT experts about your project? We’re here to help you
Tableau data analytics for uncovering insights: key features and benefits
Tableau’s ease of implementation, intuitive data visualization, interactive dashboards, drag-and-drop functionality, and high scalability and performance comprise the main advantages of this data analytics tool. Let’s take a closer look at each of them.
Ease of implementation
Tableau data analytics is easy to implement due to its user-friendly interface and extensive range of pre-built data visualization templates and charts. It simplifies the process of connecting to various data sources and creating interactive visualizations without requiring complex coding or technical skills.
Actually, creating some calculations involves a logic similar to other tools like Excel or SQL — so it may feel a little bit like coding. At the same time, the software provides clear rules and instructions: this makes the process understandable and eases the learning path for generating those calculations.
Sophisticated yet intuitive data visualization
Tableau analytics was designed specifically for data visualization. It has an intuitive interface that empowers users to create comprehensive visualizations, blend data, and build dashboards that effectively communicate complex data insights.
Tableau goes beyond simple monitoring to provide context, explain trends, and demonstrate the relationship between decisions and outcomes. This way, you can create compelling data stories and get easy-to-understand pattern explanations.
Interactive dashboards
Tableau data analytics dashboards allow users to explore data visually, drill down into specific details, filter data based on different criteria, and interactively analyze trends and patterns.
The interactive nature of Tableau’s dashboards helps create a kind of self-service analytics environment where users can even ask ad hoc questions. They can use the Ask Data feature and get an immediate response in the form of automatic data visualizations right there in Tableau. This means that users can get instant insights and make data-driven decisions on the go.
Drag-and-drop functionality
Tableau’s drag-and-drop functionality serves as a convenient way to design data visualizations and create dashboards. It allows users to simply drag and drop fields, measures, and dimensions onto the canvas, so they don’t need to code or perform any other manual manipulations.
This functionality accelerates the process of building visualizations, gives users greater control and flexibility, and enables quick iterations and explorations of different data perspectives.
High scalability and performance
The Tableau data analytics platform is highly scalable, adaptable to the needs of both big and growing organizations, and capable of delivering exceptional performance for data analysis.
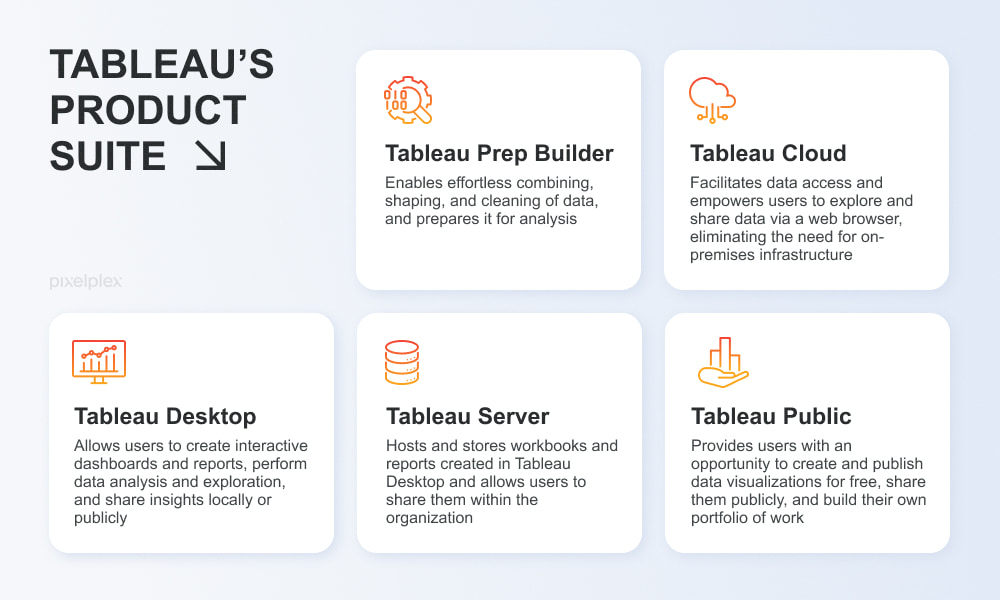
Firstly, Tableau’s architecture allows for seamless integration with various data sources, including Microsoft Excel, text and PDF files, Tableau Server or Tableau Cloud, Dropbox, Google Sheets, LinkedIn Sales Navigator, MongoDB, MySQL, Oracle, PostgreSQL, and Salesforce. This enables users to efficiently analyze and visualize extremely large volumes of data.
Secondly, Tableau’s data engine technology, known as Hyper, is optimized to swiftly ingest data and execute analytical queries on large or complex datasets. It provides advanced in-memory processing and compression techniques to optimize query performance and accelerate data retrieval.
What are Tableau business applications?
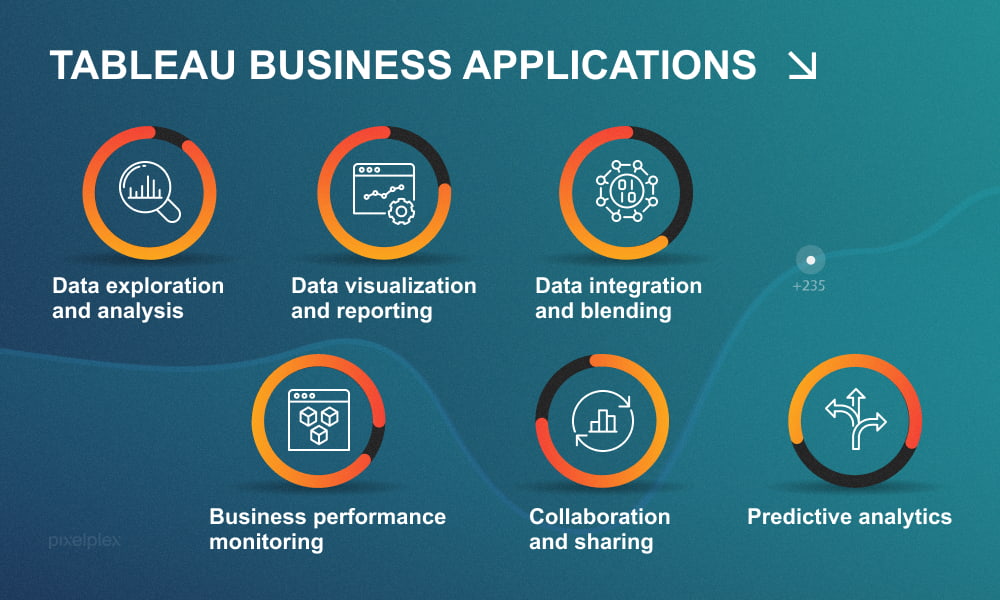
Tableau’s diverse business applications include data integration and exploration, blending, visualization and reporting, business performance monitoring, collaboration and sharing, and predictive analytics. Let’s get into the details.
Data exploration and analysis
Visual analytics with Tableau significantly aids data exploration and analysis through its comprehensive set of features. Users can connect to a range of data sources to extract and analyze data efficiently, and they can then create visualizations to explore data visually and identify patterns, trends, and outliers.
The tool also offers interactive filtering and slicing capabilities, permitting users to drill down into specific subsets of data for deeper analysis.
Data visualization and reporting
This is what Tableau visual analytics is primarily made for: it possesses exceptional capabilities in data visualization and reporting, providing organizations with a powerful tool to transform complex data into meaningful insights and impactful reports.
With Tableau data analytics, businesses can create visually compelling and interactive dashboards. The tool offers a wide range of customizable charts, graphs, maps, and other visual elements that enable users to effectively communicate data findings.
Check out how PixelPlex engineers developed this smart platform that provides users with actionable data on NFT collectibles
Data integration and blending
Tableau’s data integration and blending features bring together disparate data sources and create a unified view for analysis and reporting. This allows businesses to access and leverage data from multiple systems, departments, and external sources, facilitating a holistic understanding of their operations.
With Tableau’s data integration capabilities, users can combine and blend data and create a consolidated dataset. This enables businesses to perform cross-functional analysis, identify correlations, and derive deeper insights by exploring the relationships between different datasets.
Business performance monitoring
Tableau’s visual analytics features allow users to create dynamic and customized dashboards that display real-time data, trends, and comparisons, enabling businesses to quickly identify performance trends, anomalies, and areas that require attention.
Additionally, Tableau’s ability to schedule and automate data refreshes will ensure that the dashboards are always up to date. This presents organizations with the means to make timely decisions, address issues promptly, and optimize performance based on insights derived from the latest data.
Collaboration and sharing
Tableau’s sharing and collaboration features facilitate teamwork, allowing users to share dashboards, reports and insights with colleagues, promoting data-driven decision-making across the organization. Moreover, it can all be done live in real-time.
Tableau analytics allows you to securely share data from various data sources such as on-premise, on-cloud, and hybrid. Instant and easy collaboration and data sharing help considerably in terms of getting quick reviews or feedback on the data, leading to a better overall analysis of it.
Predictive analytics
Tableau provides organizations with powerful predictive analytics functionalities, enabling them to construct predictive models and derive insightful forecasts from their data. You can also engage with a predictive analytics company to further customize these models and unlock deeper insights. Tableau’s user-friendly drag-and-drop interface and adaptable input options allow data analysts to easily customize calculations and explore various “what-if” scenarios.
Learn more about Smart Mall — a platform designed to collect data on consumer behavior and deliver sophisticated analysis and accurate sales forecasting
A step-by-step guide: how to retrieve actionable insights using Tableau data analytics
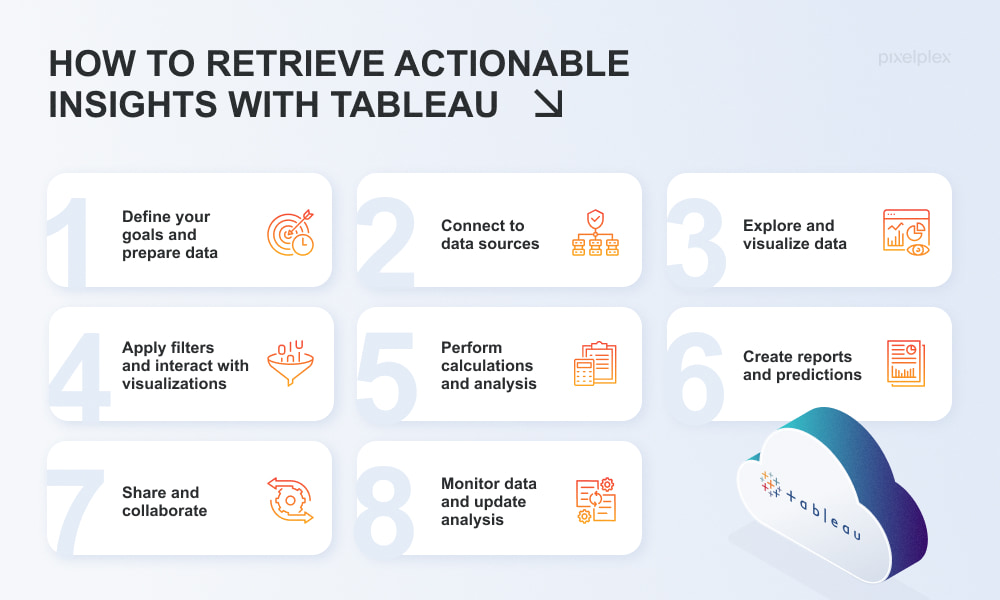
We have prepared a step-by-step guide that will help you unlock the full potential of your data and drive informed decision-making within your company using Tableau data analytics.
Step 1: Define your goals and prepare data
Clearly define the goals of your analysis and identify the specific insights you want to gain from your data:
- Would you like to analyze sales data to identify top-selling products?
- Do you need to segment customer data to gain a deeper understanding of customer preferences and needs?
- Do you plan to analyze marketing data to measure the effectiveness of your campaigns?
- Or do you want to analyze your overall business performance to identify bottlenecks, optimize processes, and reduce costs?
Once you have clear goals, collect the relevant data needed for your analysis and ensure that the data is clean, complete, and in a format suitable for analysis in Tableau visual analytics.
Step 2: Connect to data sources
Use Tableau’s data connectivity options to connect to your data sources — Microsoft Excel, Google Sheets, PostgreSQL and Salesforce, amongst others.
Step 3: Explore and visualize data
Use Tableau’s drag-and-drop interface to explore your data visually. Create comprehensive visualizations such as charts, graphs, and maps to gain a better understanding of your data.
Step 4: Apply filters and interact with visualizations
Apply filters and interact with your visualizations to drill down into specific subsets of data, allowing for a deeper analysis. With Tableau’s intuitive interface, you can easily apply filters based on a number of measures to focus on specific segments or time periods of interest. For example, you can filter data by region, product category or customer segment to understand performance at a more detailed level.
In fact, Tableau analytics provides options for interactivity beyond simple filtering. You can create interactive dashboards with actions and parameters that allow users to dynamically control the visualizations. For instance, users can select different variables to instantly update the visualizations and observe the corresponding effects.
Step 5: Perform calculations and analysis
You can perform advanced calculations and analysis, going beyond simple metrics. Whether it’s aggregating, performing statistical calculations, or creating custom formulas, Tableau supplies you with the tools to conduct sophisticated analyses and make data-driven decisions with confidence.
Do you know the difference between data science, data analytics, and big data? Here are all the answers
Step 6: Create reports and predictions
With predictive analytics in Tableau, you can design interactive dashboards and reports to present your insights. You can also organize your visualizations and create meaningful stories to communicate your findings effectively.
When deploying Tableau’s advanced analytics features, such as clustering, forecasting, and trend analysis, you will uncover patterns and make predictions based on your data.
Step 7: Share and collaborate
Share your insights with others by publishing your dashboards and reports to Tableau Server. Collaborate with your team members to gather feedback and refine your analysis.
Step 8: Monitor data and update analysis
You need to continuously monitor your data and update your analysis as new data becomes available. If you iterate your analysis, you will gain deeper insights and understand your data better.
By following these steps, you can leverage Tableau’s data analytics capabilities to retrieve actionable insights from your data and make better, more informed decisions for your organization.
Final thoughts
Embracing Tableau data analytics can revolutionize the way your business extracts actionable insights. Its user-friendly interface, advanced visualization capabilities, and interactive dashboards give businesses the green light to quickly and efficiently identify crucial trends, uncover untapped opportunities, and make more informed decisions.
However, navigating the complexities of big data requires the expertise of a seasoned partner. Why not turn to PixelPlex business intelligence company? With their extensive knowledge, the team can guide you through the intricacies of data analysis and help your organization grow.
Don’t miss out on the transformative power of data analytics services, take the next step and collaborate with PixelPlex to unlock the full potential of your data-driven strategy.