
Power BI is widely recognized as a robust business intelligence solution, enabling businesses to capture actionable insights. But are there other comparable, powerful alternatives available in the market?
Developed by Microsoft, Power BI helps users visualize and analyze data across various dimensions. It integrates data from multiple sources, including spreadsheets, databases, and cloud services and enables users to create detailed reports and dashboards.
With Power BI, users can customize visualizations and adapt them to specific business needs, which makes it suitable for a range of applications such as business reporting, data analysis, visualization, predictive analytics services, and data exploration.
The key features of Power BI include:
- Interactive visualizations. Customizable visualizations, including bar charts, line graphs, pie charts, and maps.
- Data connectivity. Ability to connect to various data sources in multiple formats, such as Excel spreadsheets, SQL databases, and cloud services like Azure and Salesforce, as well as gathering data from the web.
- Data modeling. Use of Data Analysis Expressions (DAX) to specify calculations and create calculated columns and measures.
- Dashboards and reports. Ability to create visualizations connected to a single platform and to combine multiple visualizations into a single dashboard and report for easy metric analysis.
- Natural language query. Users can ask questions about their data in natural language and receive instant graphical representations.
However, despite this impressive feature set, there are many alternative solutions on the market that offer comparable or even superior features and pricing options. For organizations looking to integrate advanced analytics into immersive environments, partnering with a provider offering metaverse development services can open new avenues for data visualization and user interaction.
The goal of this article is to compare the most prominent Power BI alternatives based on their feature sets and suitability for different businesses and to provide tips on selecting an efficient business intelligence tool.

What Is Self-Service BI, And How Can It Benefit Your Business?
Looking for a reliable data visualization team? Talk to our experts
Top 8 Power BI Alternatives
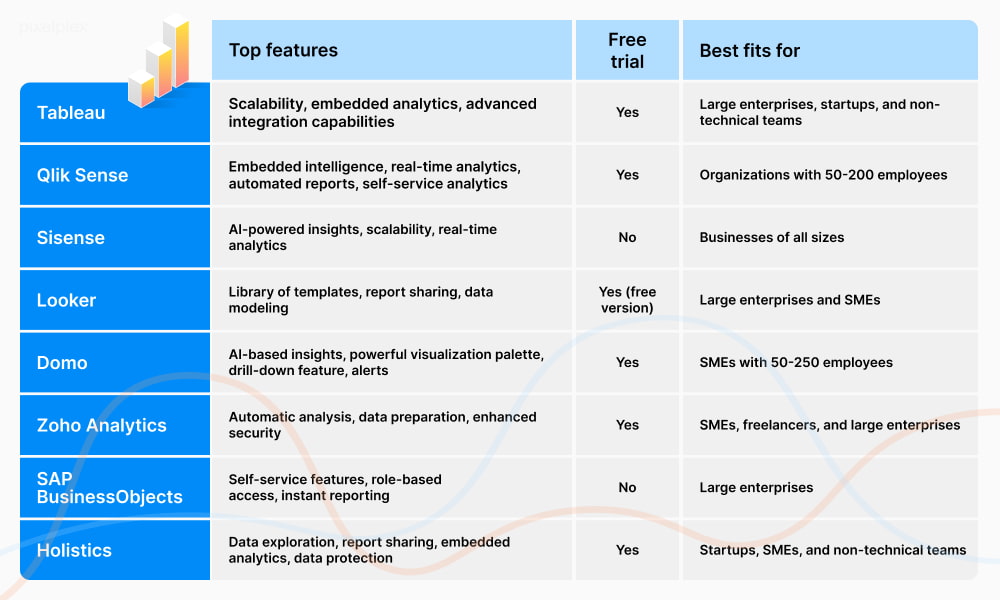
Our IT consulting company collected the top 8 Power BI alternatives that you can consider for your business.
1. Tableau
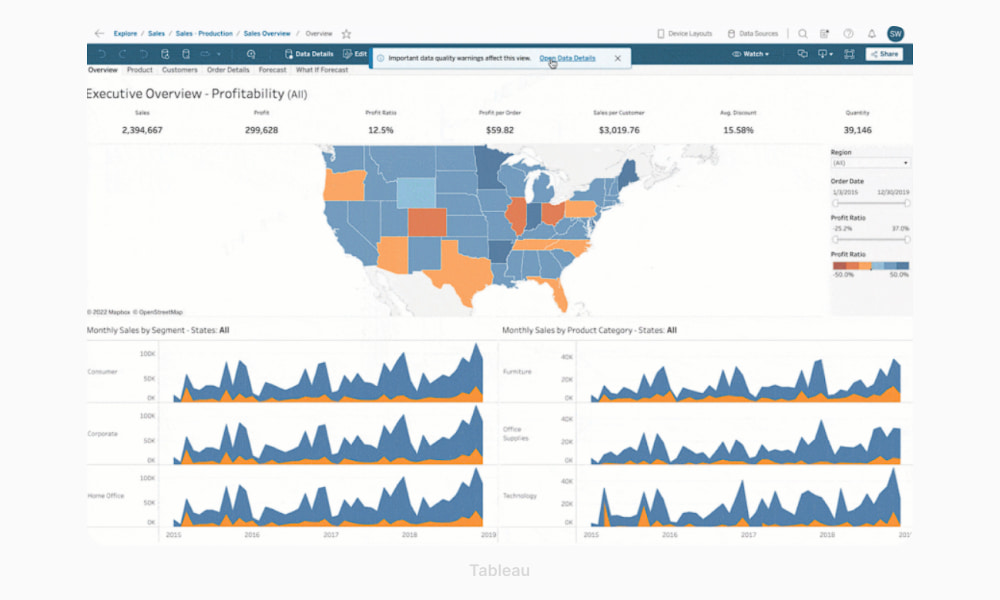
Tableau is one of the most popular Power BI alternatives. It’s a business intelligence tool where users can create interactive dashboards, reports, and visualizations, pulling data from multiple sources. It offers several versions, with the Desktop and Cloud variations being the most popular ones.
The main goal of this BI tool was initially to make business intelligence features accessible and useful for professionals in marketing, sales, and customer service. Over time, the platform has evolved into a comprehensive enterprise solution that caters to both expert analysts and non-technical users alike.
Tableau is frequently employed for reporting and key performance indicators and assessing departmental performance metrics. It is also commonly integrated with other analytical tools to construct sophisticated data models.
Key features:
- Advanced integration capabilities. Can connect to a variety of data sources, such as relational databases, data warehouses, cloud applications, and big data streams.
- Highly scalable. Capable of handling large volumes of data.
- Embedded intelligent analytics. Incorporates ML and AI capabilities to provide intelligent analytics at scale.
Top advantage: interactive and shareable dashboards
Top disadvantage: quite expensive, especially for small teams and startups
Pricing: starts from $15/month
Best suits for:
- Large enterprises and startups
- Marketing, sales, and customer service users
- Data analysts
Peer review (verified by Gartner):
- Overall rating: 4.4/5 (same as Power BI)
- Overall capability score: 4.5/5 (Power BI – 4.4)
- Pricing flexibility: 3.7/5 (Power BI – 4.2)
- Integration and deployment overall rating: 4.3/5 (Power BI – 4.4)
- Service and support: 4.3/5 (same as Power BI)

How to Uncover Actionable Insights Using Tableau Data Analytics
2. Qlik Sense
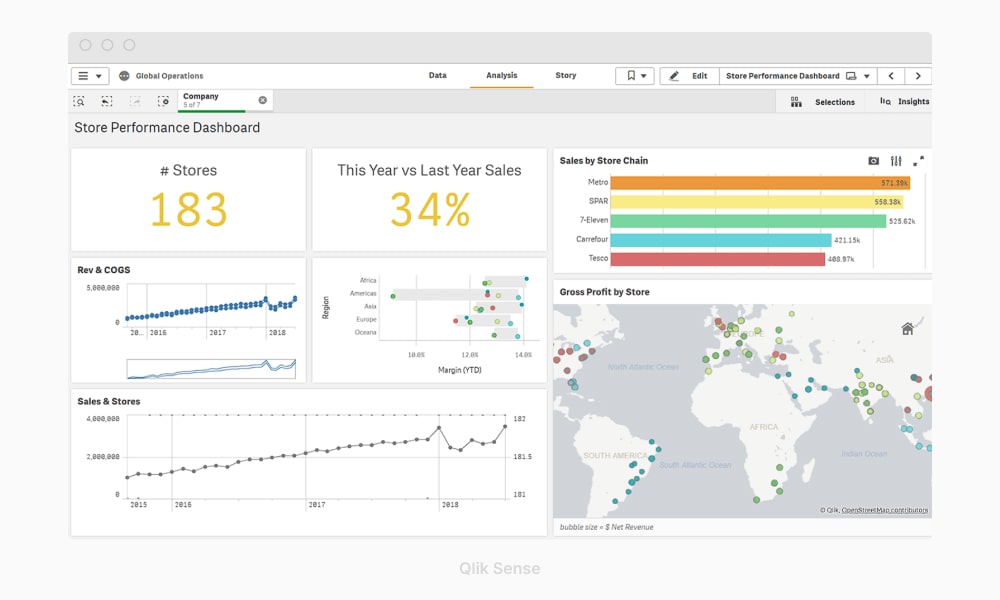
Qlik is a seasoned entity in the business intelligence sector whose latest offering, Qlik Sense, was built on the legacy of its predecessor QlikView.
Setting itself apart from other alternatives like Power BI, Qlik Sense does not employ a standard query-based approach. Instead, it utilizes a unique associative analytics engine. Furthermore, the system is enhanced with embedded artificial intelligence algorithms that assist in selecting optimal chart types and interpreting the data’s significance. The tool also incorporates natural language capabilities, allowing users to query and interact with their data conversationally.
Overall, Qlik Sense is a powerful business intelligence tool that scales easily across various business sizes, from small firms to large enterprises, with performance that adjusts based on the deployment options chosen.
Key features:
- Embedded intelligence. Integrates AI and machine learning to provide smarter, automatically generated insights and predictions.
- Real-time analytics and automated reports. Delivers real-time data to provide teams with immediate insights and act accordingly.
- Self-service analytics. Provides self-service capabilities with a strong emphasis on guided analytics paths.
Top advantage: A unique associative engine that enables intuitive, non-linear exploration of data relationships across multiple sources
Top disadvantage: A learning curve involved in fully leveraging the unique associative data model of the tool
Pricing: starts from $20/month
Best suits for:
- IT industry
- Finance sector
- Organizations with 50-200 employees
Peer review (verified by Gartner):
- Overall rating: 4.5/5 (Power BI – 4.4)
- Overall capability score: 4.4/5 (same as Power BI)
- Pricing flexibility: 4.0/5 (Power BI – 4.2)
- Integration and deployment overall rating: 4.3/5 (Power BI – 4.4)
- Service and support: 4.3/5 (same as Power BI)
3. Sisense
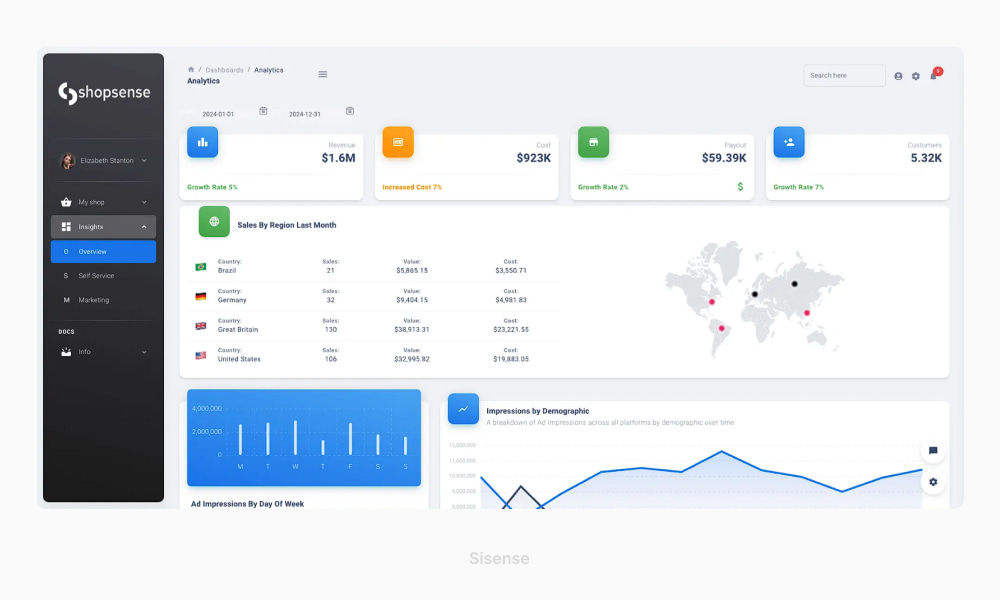
Sisense is a comprehensive business intelligence platform designed to facilitate the preparation, analysis, and visualization of complex and multi-dimensional datasets. It specifically excels in handling big data sets and data streams, which enables users to efficiently process and visualize large volumes of data.
The platform is equipped with a suite of features, such as interactive dashboards, self-service analytics, and a diverse array of data connectors that enhance its usability and effectiveness.
Sisense is particularly recognized thanks to its In-Chip technology, which delivers fast performance even when managing extensive datasets. This makes it an attractive alternative to Power BI, especially for teams without big technical expertise.
Key features:
- AI-powered insights. Enables users to generate AI-based insights from their data.
- High scalability. Leverages the containerized architecture that scales up easily.
- Real-time analytics. Connects to data warehouses and analyzes the raw data instantly.
Top advantage: The proprietary In-Chip technology that allows for fast data processing and ensures high efficiency at handling large datasets
Top disadvantage: Fully leveraging its advanced features may require a significant investment in terms of learning and development
Pricing: available on request
Best suits for:
- Businesses of all sizes dues to its custom quotes and tailored solutions
Peer review (verified by Gartner):
- Overall rating: 4.1/5 (Power BI – 4.4)
- Overall capability score: 4.3/5 (Power BI – 4.4)
- Pricing flexibility: 4.3/5 (Power BI – 4.2)
- Integration and deployment overall rating: 4.3/5 (Power BI – 4.4)
- Service and support: 4.5/5 (Power BI – 4.3)
4. Looker
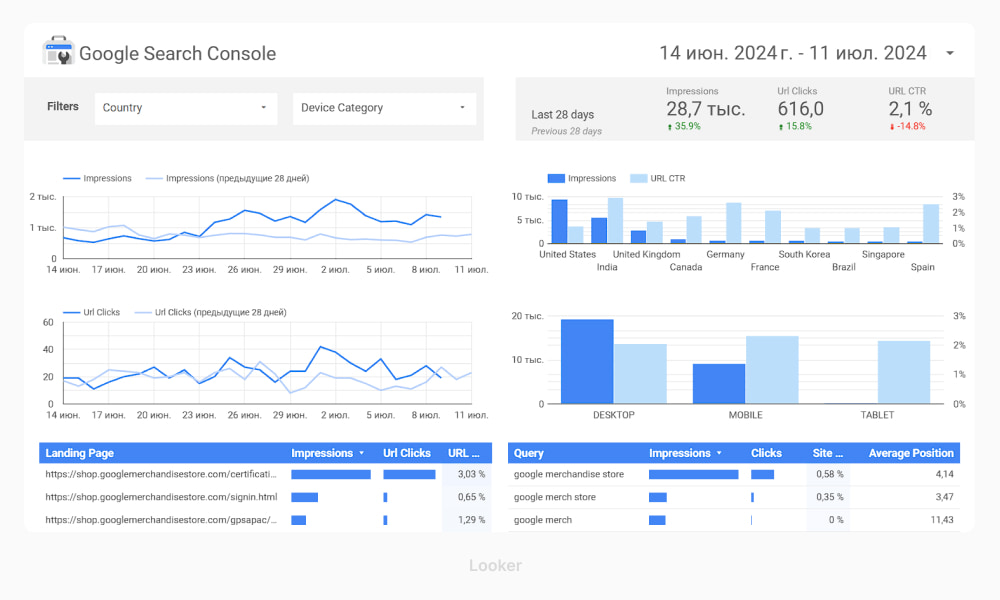
Previously known as Google Data Studio, Looker is a contemporary business intelligence platform that continues the tradition of Data Studio by offering powerful visualization and data storytelling capabilities. The tool is entirely browser-based and it doesn’t require installation or setup, being accessible as long as you have a Google account.
Looker has a clear and straightforward interface, especially for tasks that do ot involve extensive data transformation or sanitation. Using the tool, you can quickly generate reports and dashboards by selecting from built-in connectors or choosing from over 800 connectors developed by Looker’s partners.
Looker provides a wide array of analytical tools, including embedded analytics and predictive modeling. It also features Looker Blocks, which allow users to leverage pre-existing work, facilitating efficiency and preventing the need to start from scratch.
Key features:
- Library of templates. Offers dozens of templates that speed up the report creation process.
- Report sharing. Allows users to generate a link to share reports, including with external users.
- Data modeling. Provides a specialized modeling language for sophisticated data interpretation.
Top advantage: A large number of built-in connectors and more than 800 partner connectors
Top disadvantage: A lack of native support for data blending, which complicates the process of combining data from multiple sources into a single view
Pricing: Pro version starts from $9/month
Best suits for:
- Large enterprises
- Software development companies
- B2C and B2B companies
- SMEs
Peer review (verified by Gartner):
- Overall rating: 4.4/5 (same as Power BI)
- Overall capability score: 4.5/5 (Power BI – 4.4)
- Pricing flexibility: 4.3/5 (Power BI – 4.2)
- Integration and deployment overall rating: 4.5/5 (Power BI – 4.4)
- Service and support: 4.5/5 (Power BI – 4.3)
5. Domo
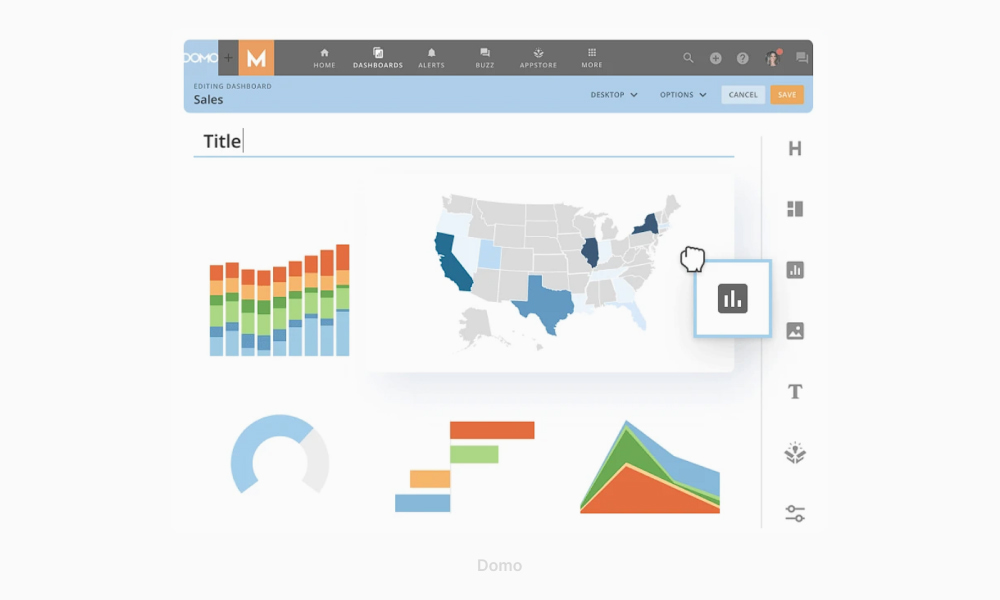
Domo is a business intelligence platform that is known for its robust capabilities in business process automation and real-time decision-making. It facilitates these processes through both low-code and pro-code applications that streamline the automation of business insights and enable quicker and more informed decision-making.
The platform is also enhanced by advanced visualizations and capabilities in AI & data science, which elevate its analytics offerings.
Domo has more than a thousand connectors, along with built-in, drag-and-drop ETL tools that simplify the data integration process. Furthermore, Domo offers interactive visualizations and dashboards, with a strong focus on self-service analytics, allowing users to easily create and customize their analytical views.
Key features:
- AI-powered insights. Has integrated AI algorithms and ML models that ensure advanced analytics.
- Powerful visualization palette. Allows users to select from over 150 different data chart types for creating detailed visualizations.
- Drill-down functionality. Enables users to easily define a drill path without any coding requirement, which facilitates deep data discovery through slicing and dicing operations.
- Alerts. Offers an alerts system where users can set notifications to appear in their workspace whenever there are changes to the data, thus ensuring they stay updated in real-time.
Top advantage: Adopts a cloud-native approach and enables real-time data updates and emphasizes collaboration and mobile access, which makes it ideal for dynamic and distributed teams
Top disadvantage: Can be costly for small businesses and may experience performance issues when handling extremely large datasets
Pricing: pay-as-you-go model.
Best suits for:
- SMEs with 50-250 employees
- Companies making SaaS products
- IT, marketing, and finance sectors
Peer review (verified by Gartner):
- Overall rating: 4.5/5 (Power BI – 4.4)
- Overall capability score: 4.5/5 (Power BI – 4.4)
- Pricing flexibility: 4.1/5 (Power BI – 4.2)
- Integration and deployment overall rating: 4.5/5 (Power BI – 4.4)
- Service and support: 4.4/5 (Power BI – 4.3)
6. Zoho Analytics
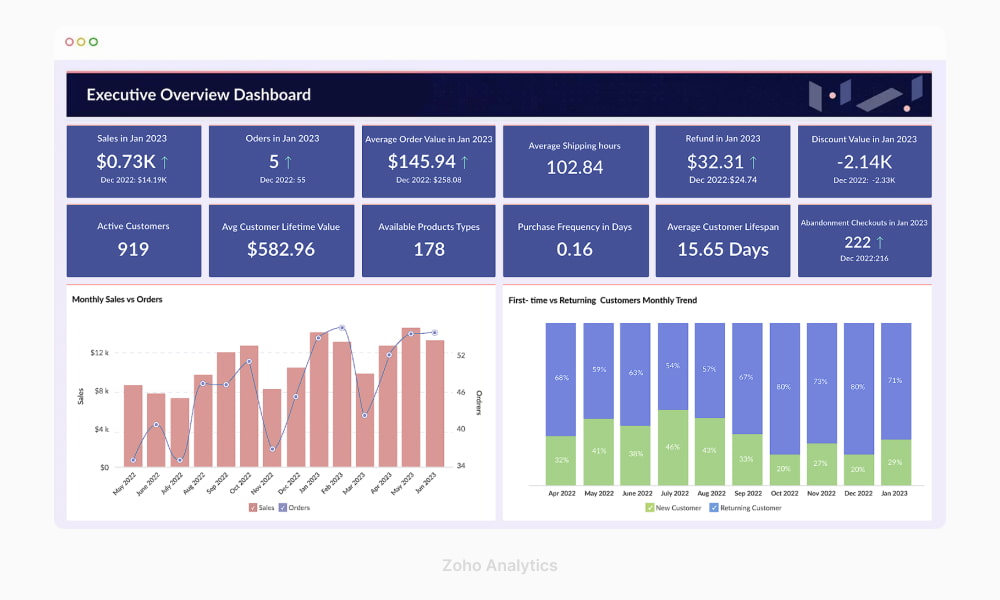
Zoho Analytics is a versatile tool designed for a wide range of business intelligence, visualization, and data analytics tasks. It allows users to easily create detailed reports, KPIs, and dashboards from diverse data sources with a do-it-yourself approach.
The tool boasts a user-friendly interface making it a popular choice among startups and small to medium-sized enterprises (SMEs). Large corporations, including Philips, Ikea, and Suzuki, also utilize it extensively. For those already using Zoho products in their daily operations, Zoho Analytics can be particularly convenient, as it seamlessly integrates into their existing workflows.
Key features:
- Automatic analysis. Allows users to select the desired table, after which the system automatically generates reports and dashboards based on that selection.
- Data preparation. Allows for AI-based data preparation and cleaning, thereby helping users to organize data properly for further analysis.
- Enhanced security and user management. Offers different user roles, each with specific permissions tailored to the features and functions they can access within the app.
Top advantage: Easily keeps track of complex datasets and KPIs
Top disadvantage: Can be challenging to integrate the tool for white label and embedded use cases
Pricing: starts from $24/month
Best suits for:
- SMEs
- Large enterprises
- Freelancers
- Non-profit organizations
Peer review (verified by Gartner):
- Overall rating: 4.3/5 (Power BI – 4.4)
- Overall capability score: 4.5/5 (Power BI – 4.4)
- Pricing flexibility: 4.3/5 (Power BI – 4.2)
- Integration and deployment overall rating: 4.5/5 (Power BI – 4.4)
- Service and support: 4.4/5 (Power BI – 4.3)
7. SAP BusinessObjects
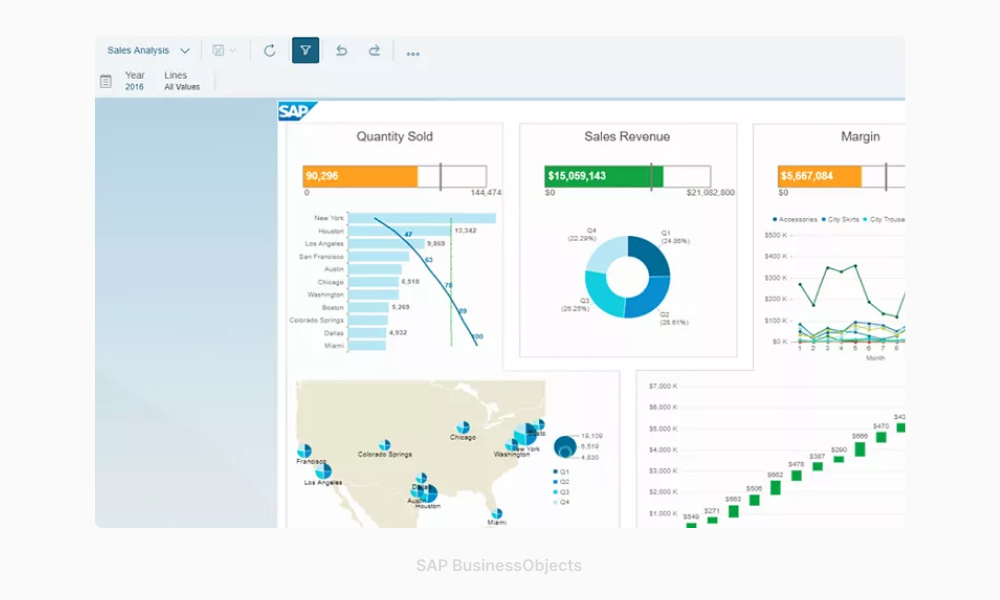
SAP BusinessObjects BI Suite is a comprehensive, centralized suite for data reporting, visualization, and sharing. Positioned as the on-premise BI layer for SAP’s Business Technology Platform, it efficiently converts data into actionable insights that are accessible anytime and anywhere. A popular Power BI alternative among large enterprises, the tool boasts increased scalability and is capable of effectively supporting businesses ranging from thousands to millions of customers.
The suite is user-friendly thanks to its intuitive drag-and-drop interface. This design allows analysts and data engineers to leverage the tool without the need for special coding skills. In addition, Business Objects boasts versatile connectivity options, accommodating a range of data sources including OLAP and XML, and integrates seamlessly with numerous platforms like SharePoint, Java, Microsoft Office, and .NET.
Key features:
- Self-service features. Provides users with self-service tools to combine data, analyze trends, and present insights.
- Role-based access. Allows for creating role-based BI dashboards that deliver information to decision-makers.
- Instant reporting. Enables users to instantly create ad-hoc reports and share their findings.
Top advantage: Supports a wide range of reporting and analysis needs across an organization along with deep integration with SAP ERP systems
Top disadvantage: Has a steep learning curve, particularly for new users who are not familiar with enterprise-level BI solutions
Pricing: starts from $14000/year.
Best suits for:
- Large enterprises, particularly those already using SAP products
Peer review (verified by Gartner):
- Overall rating: 4.2/5 (Power BI – 4.4)
- Overall capability score: 4.2/5 (Power BI – 4.4)
- Pricing flexibility: 3.8/5 (Power BI – 4.2)
- Integration and deployment overall rating: 4.1/5 (Power BI – 4.4)
- Service and support: 4.0/5 (Power BI – 4.3)
8. Holistics
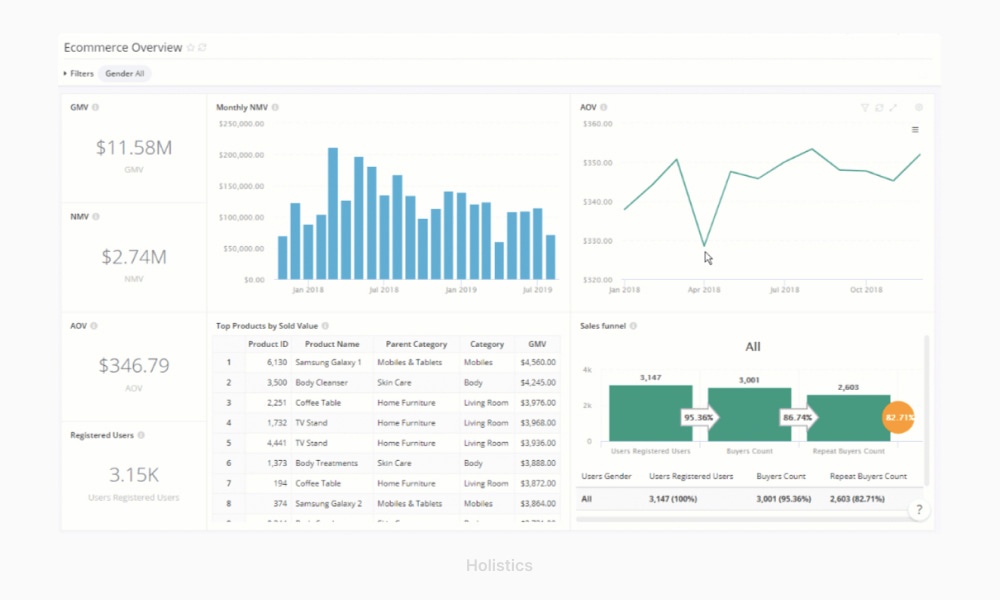
Holistics is a versatile business intelligence and data analytics tool that provides various visualization functionalities, from interactive dashboards to data reporting. It allows users to easily connect to multiple data sources and share insights among stakeholders.
The tool offers an intuitive user interface and flexibility in customization, being a good choice for small and medium-sized businesses.
While Holistics is accessible and user-friendly for non-technical users, it also caters to developers and professional analysts by offering advanced tools. The tools allow such users to define custom data logic using Python code and embed analytics reports into other applications, thus enhancing its utility across different user levels within an organization.
Key features:
- Data exploration. Includes slice-and-dice features that allow users to delve into and navigate through datasets easily.
- Report sharing. Offers various methods to share dashboards or reports, including email, PDF, and integration with Google Sheets.
- Embedded analytics. Reports and dashboards created using Holistics can be seamlessly integrated into other applications.
- Data protection. Incorporates mechanisms that provide role-based access to sensitive data, ensuring data security.
Top advantage: Supports self-service capabilities for non-tech users
Top disadvantage: Design options are quite limited and there are not many opportunities for customization
Pricing: starts from $150/month
Best suits for:
- Small businesses and startups
- Medium-sized companies
- Marketers, sales teams, and other non-technical users
Our big data consultants will help you select the best data analytics tool for your specific business case. Contact us with your query
How to select the right BI tool for your needs?
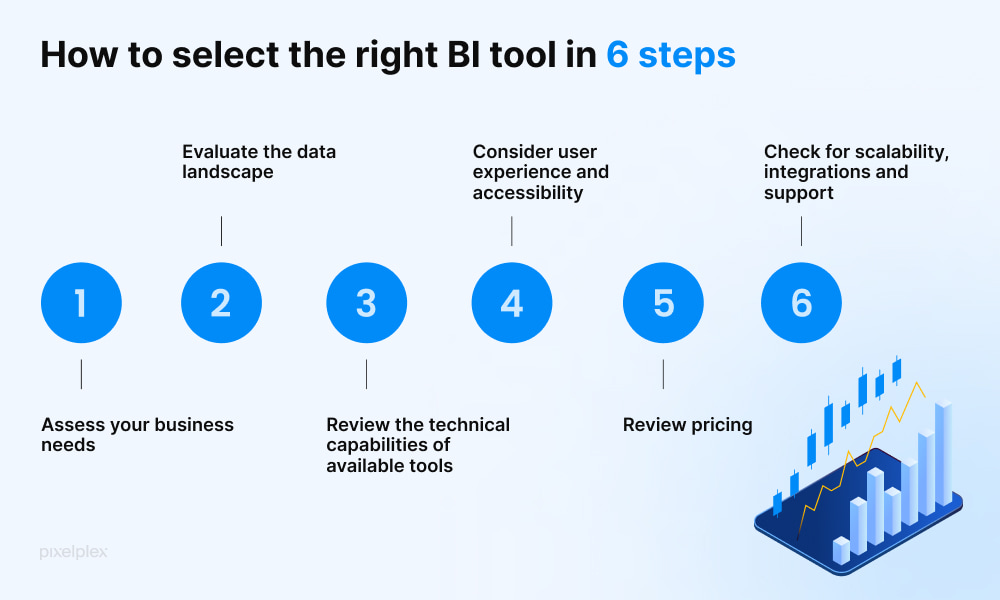
Choosing the right business intelligence tool for your organization requires a thorough assessment of several key factors, such as a careful evaluation of your business requirements and the data landscape.
Below is a structured approach to guide you in selecting the appropriate BI tool.
Step 1. Assess your business needs
Start by clearly identifying the specific problems your organization aims to solve with a BI tool. Determine the key performance indicators that matter most to your business and consider how a BI tool can help monitor and achieve these goals.
Step 2. Evaluate the data landscape
Analyze the data you currently have, how it’s collected, and how you want to use it. Look at the various data sources your organization utilizes, be it internal systems, cloud storage, or external databases, and consider the integration capabilities of the BI tool. This will help you choose the tool that can handle the complexity and volume of your data effectively.
Step 3. Review the technical capabilities of available tools
Examine the specific features offered by different BI tools and match them with your business requirements. Some of the important features to pay attention to are real-time data visualization, AI-powered analytics, mobile access, ease of use for both technical and non-technical users, and automated reporting.
Check out top 15 big data analytics tools worth exploring
Step 4. Consider user experience and accessibility
Think about who will be using the BI tool. It’s important that the tool is accessible and understandable for all intended users, whether they are data analysts or business executives. Look for a tool with a user-friendly interface and consider the learning curve associated with it.
Step 5. Review pricing
Understand the total cost of ownership, including initial costs, licensing fees, training, and any ongoing maintenance expenses. Then, compare these costs against the expected benefits, such as improved efficiency, better decision-making, and other strategic advantages the tool will bring.
Step 6. Check scalability, integration, and support features
Ensure that the BI tool can scale as your business grows and can integrate smoothly with your existing tech stack. This includes verifying compatibility with current data management systems and any future technology plans.
Also, evaluate the level of support offered by the BI tool provider. This includes technical support, customer service availability, and the provision of updates. Adequate support is crucial for resolving potential issues quickly and efficiently.
Summing up
A BI tool that aligns well with your business strategies, integrates seamlessly with your existing systems, and scales with your growth can drive better business decisions.
Whether you’re looking for a Power BI alternative or simply a BI solution that meets your current business needs and requirements, including necessary integrations and custom features, consider consulting with experts who can guide you through the process.
At PixelPlex, our business intelligence consultants specialize in assessing your needs and recommending the right BI tools that will offer the most value to your organization.
Contact our team for expert advice. We will help you choose the best tool to enhance your business intelligence capabilities. We can also assist you with any software development and IT consulting challenge, whether it’s implementing web accessibility consulting services to ensure inclusivity or optimizing your existing infrastructure.