
In today’s information-driven world, businesses must be able to unlock the power of data straight away if they are to remain competitive. Fortunately, there are tools that help us to efficiently visualize this data — with Power BI leading the charge.
According to Statista, global data creation is projected to reach more than 180 zettabytes by 2025.
Any business, regardless of its size and domain, produces enormous volumes of data.
However, only a small number of companies can use this data to spot insights and patterns in different datasets. This is precisely where the demand for various business intelligence tools and data analytics services comes in.
With its robust features and advanced capabilities, Power BI has proven to be a game changer in enabling businesses to quickly extract valuable insights. In this article, we will dive deep into the world of Power BI data visualization services and explore the most effective ways to bring your data to life.
Why is data visualization important?
Data visualization presupposes taking raw data and transforming it into visual representations, such as graphs, live charts, and diagrams. These visualizations provide businesses with a comprehensive view of their data, enabling them to make informed decisions.
Data visualization helps businesses:
- See the big picture and spot trends
- Quickly identify how the business is performing and make adjustments if necessary
- Make informed decisions using tangible insights and concrete numbers
- Track trends over time and make strategic decisions
Planning to enable tech-powered business transformation? Talk to our IT consultants
What is Power BI?
Power BI is a data visualization tool that allows businesses to connect their data and transform it into interactive visuals, providing valuable information. Power BI data analytics enables you to embed custom visualizations into your app or web platform and connect hundreds of data sources, such as Google Analytics, Excel, and IoT devices, in order to get real-time data insights.
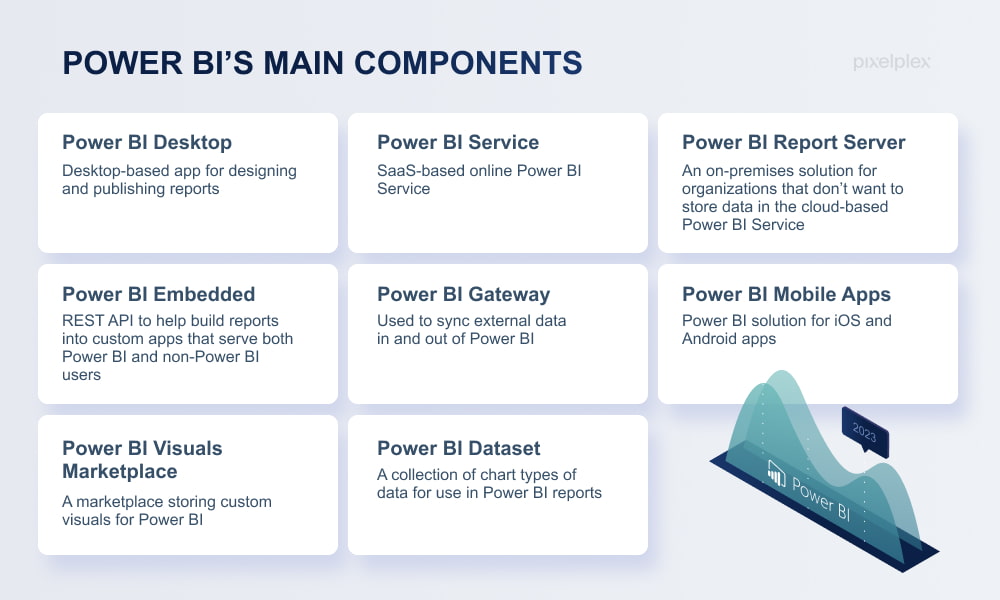
Power BI’s main components
Power BI advantages
The main advantages of using the Power BI data visualization and business intelligence consulting include:
- Advanced toolset, allowing for data warehousing, data discovery, and interactive dashboards
- The ability to load custom visualizations
- Cloud-based and desktop-based interfaces
- Ease of scalability across the entire organization
How to implement Power BI data visualization
Implementing Power BI data visualization will require you to complete four key steps: data integration, data transformation, report creation, and dashboard implementation.

Data integration
Power BI enables you to extract data from different sources, including Excel files and online servers. You can connect to these sources and import the data with the help of Power BI connectors.
Power BI is capable of compressing data sets up to 1GB, and it uses direct query if the compressed data sets exceed 1GB. After that, the data is integrated into a standard format and stored in a staging area.
Once connected, Power BI data analytics will provide a consolidated view for analysis and visualization of data sources.
Data transformation
For effective visualization, data should be cleaned and pre-processed. Power BI provides a comprehensive set of data transformation capabilities, from cleaning the data to merging or splitting columns, eliminating duplicates, and creating calculated columns and measures.
After the data is pre-processed, cleaned, and transformed, it is loaded into the data warehouse.
Report creation
When your data is ready, you can create reports — data visualizations in the form of charts, graphs, and slicers. Using Power BI’s interface, you can drag and drop data fields into the report canvas, choose from a wide range of custom visualizations — such as charts, maps, and tables — and customize their formatting and appearance.
In addition, you can apply filters and interactive features, such as drill-through, and create calculated fields. Once the reports are complete, you can publish and share them with your organization.
Dashboard implementation
Power BI dashboards provide you with a consolidated view of key stats, metrics, and visualizations. After publishing reports to Power BI services, the tool empowers you to create interactive dashboards by pinning report visuals, tiles, and KPIs to a single canvas.
As a result, you can easily monitor your business metrics, compare data across visuals, and make informed decisions. You can also share the created dashboards with your organization to enable collaborative decision-making.

How to Uncover Actionable Insights Using Tableau Data Analytics

10 Best Business Intelligence Platforms of 2026
Find out about the difference between data analytics, data science, and big data
Best ways to visualize data with Power BI
There are a multitude of Power BI data visualization examples, from cards and maps to donuts and slicers. Below you will find the most impactful methods of visualizing data.
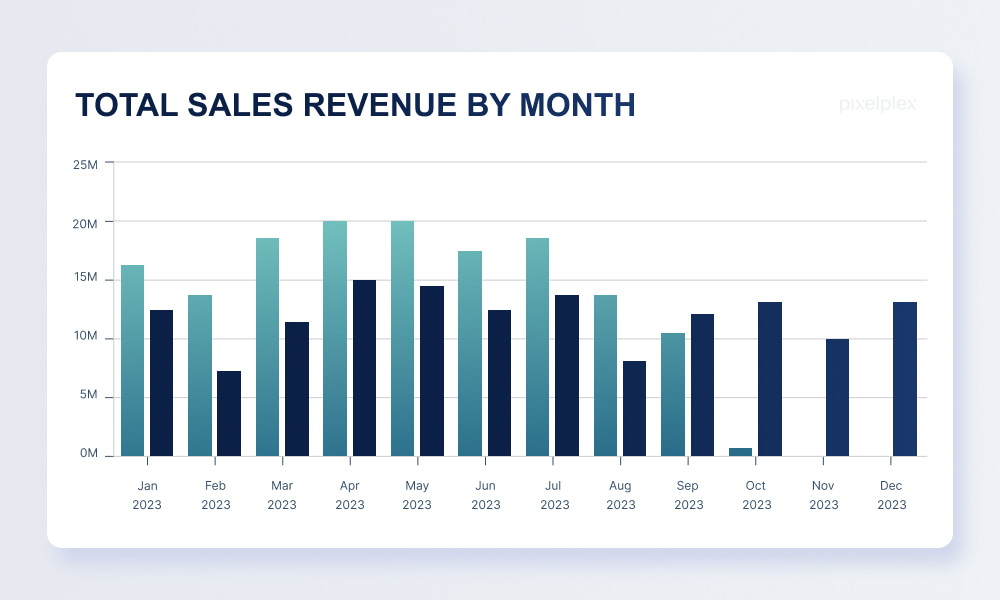
Bar charts
A bar chart is a popular Power BI data visualization technique due to its simplicity and ease of interpretation. You can customize different aspects of the bar chart, including color, width, and orientation of bars to highlight important insights.
Bar charts best suit those instances when you need to display data in a matrix chart that contains negative values, since the positioning of bars can be flexibly adjusted both above and below the x-axis. They are often used to compare and analyze data across different categories as well as track changes over time.
Line charts and area charts
A line chart displays changes over time through the use of data points represented by dots that are connected by a straight line. Power BI provides different customization options for line charts, such as the ability to adjust line styles, colors, and data labels.
It is recommended to use line charts when there is a need to display data series that have a chronological or sequential relationship. Therefore, they are excellent for comparing data trends, and for highlighting increases, decreases, or fluctuations over time.
Area charts are similar to line charts, but they have an additional color that creates a shaded area beneath the line. They are mainly used to showcase the extent of variation between two or more data points. They are a very good choice for depicting metrics that show the volume of a trend across time, such as monthly sales volume, project progress volume, and market trading volume.

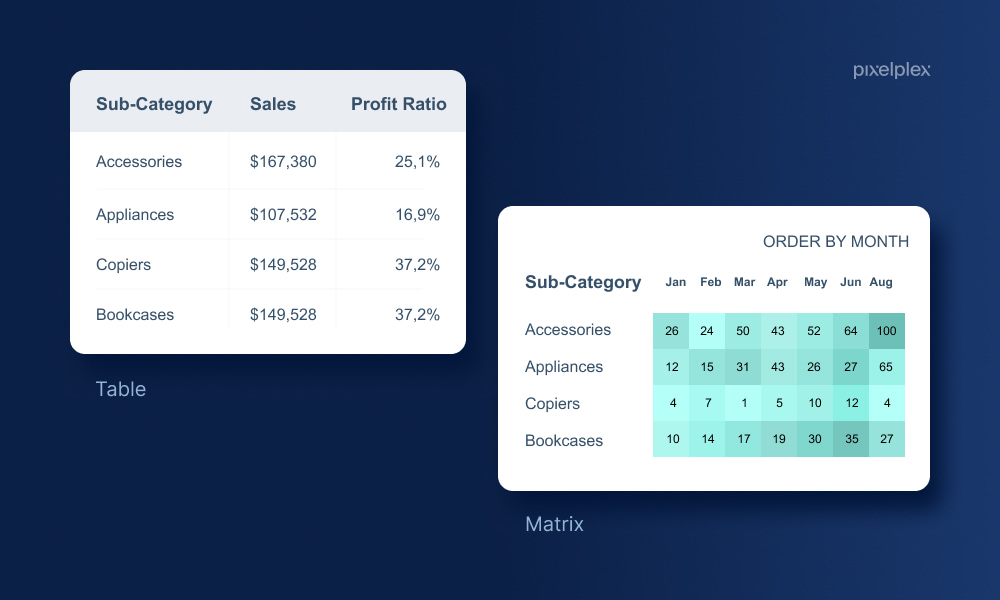
Table and matrix
The table and the matrix are quite similar Power BI data visualization examples. Tables allow you to display data in a tabular format: they are used for quantitative comparisons, enabling you to examine and compare data across different dimensions.
While matrices in Power BI have much in common with tables, they provide additional capabilities, allowing users to aggregate and summarize data based on a number of dimensions. Some good examples of when it’s better to opt for matrices include evaluating revenue by specific region or year, analyzing customer satisfaction scores by product category, or comparing sales by business segment.
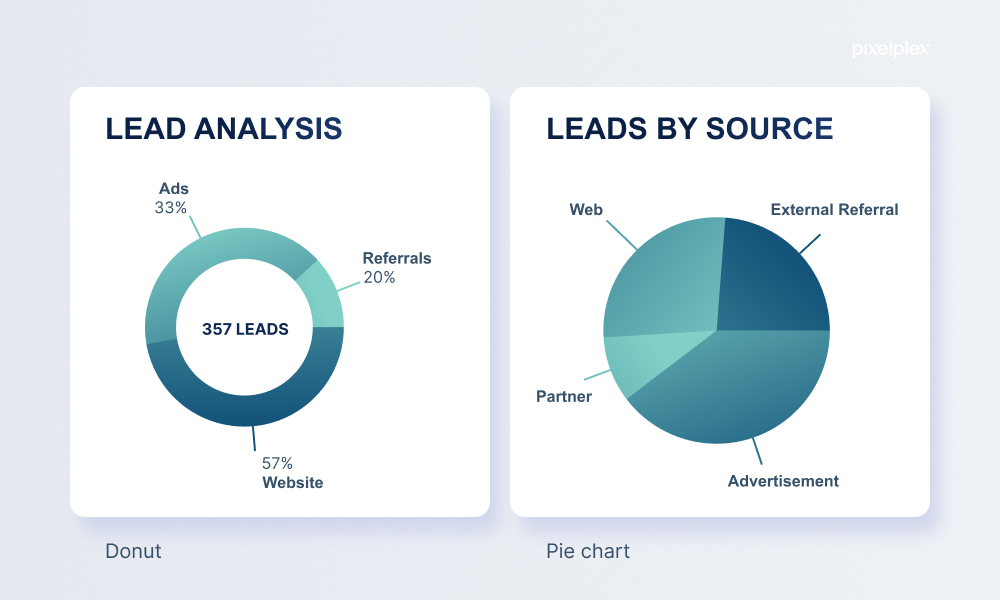
Donut and pie chart
Donut is another popular Power BI data visualization technique that allows users to display data with multiple categories and segments. It presents data in a circular format, which allows for easy comparison of relative proportions and percentages.
Power BI provides numerous customization options for donut charts, from data labels and tooltips to drill-through capabilities, thus enabling you to highlight specific features, add more context, or drill down into detailed information when necessary.
Donut charts also support interactive features such as slicing, filtering, and custom visualization, which enhance data examination and analysis.
A pie chart is a similar visualization method. It presents data as a circular graph, divided into slices, and is ideal for showing categorical data, where each slice of the dial chart represents a specific category and its size represents the proportion it holds within the whole.
Both pie charts and donuts are typically used to show market share by product, as well as customer segmentation, expense distribution by category, and similar values.
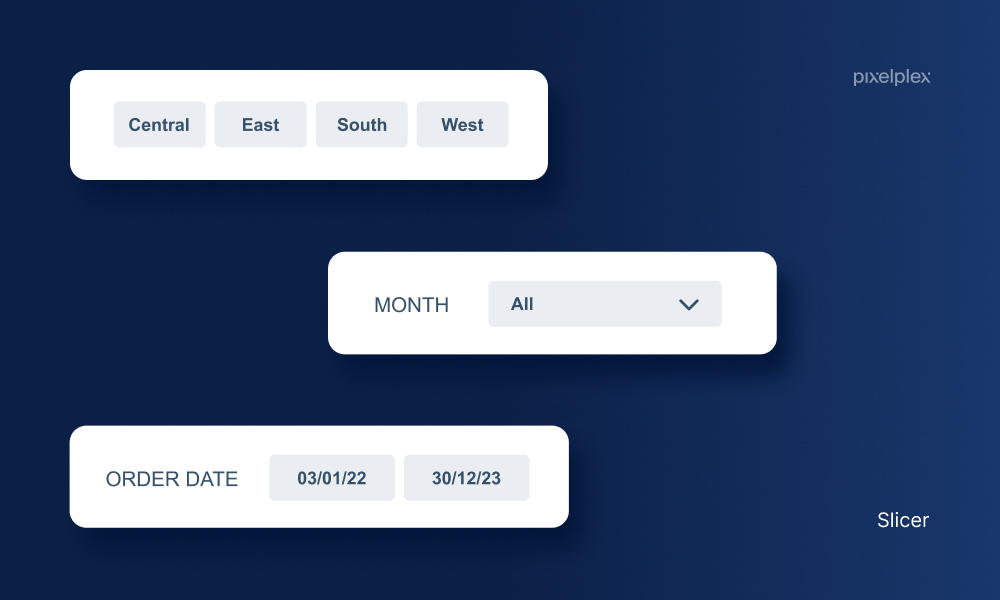
Slicer
Slicers in Power BI are mainly used to filter data based on different dimensions — for example, geographic regions or product categories. Users can choose a specific value from the slicer, and the data displayed in other visualizations on the same page will dynamically update in line with the selected value. This way, users can focus on specific subsets of data to gain deeper insights.
Power BI provides different types of slicers, including checkboxes, dropdown lists, range sliders, and hierarchical sliders.
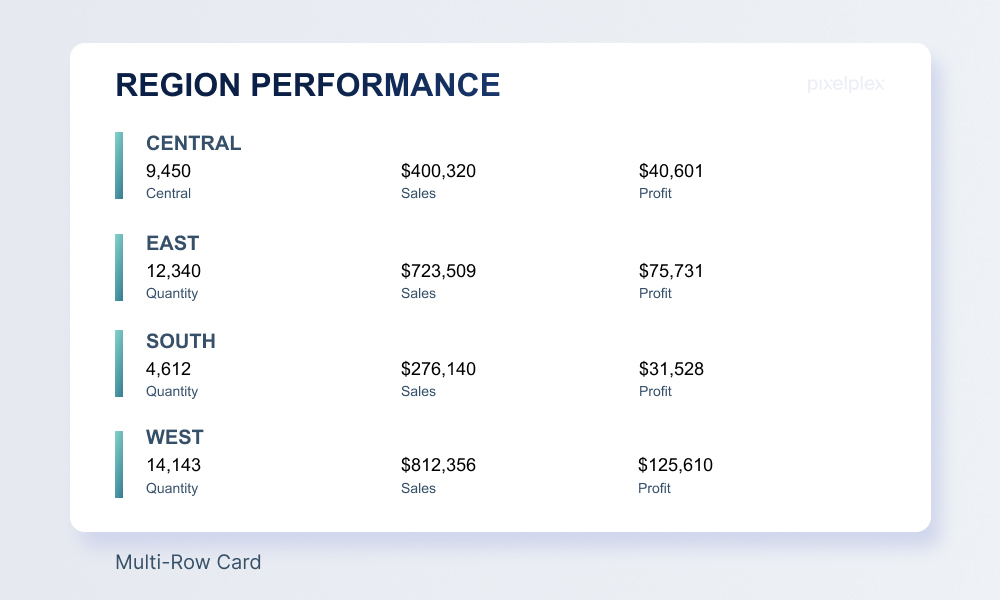
Multi-row card
A multi-row card in Power BI is a card visualization type that groups several individual cards into one visual. As with simple cards, multi-row cards are best used to represent different KPIs and high-level metrics.
You can also use multi-row cards to display the status of a certain process or a goal to improve decision-making.
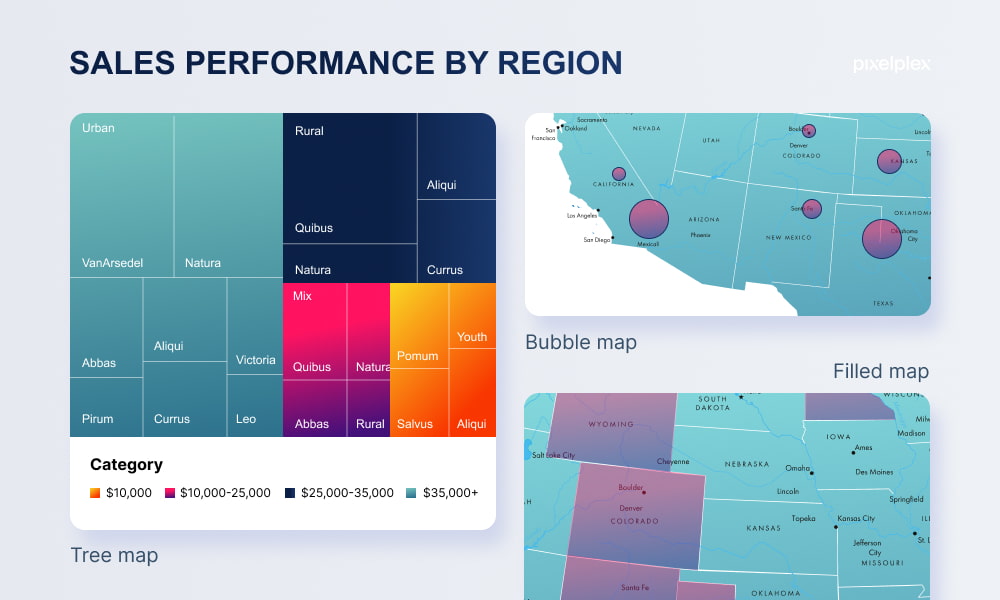
Maps
Maps are powerful data visualization techniques in Power BI that allow you to represent data geographically, delivering insights into spatial patterns, distribution, and relationships. The most common types in Power BI include tree maps, bubble maps, and filled maps.
Tree maps display data hierarchically within nested rectangles, where the size of each rectangle represents a quantitative value. Power BI’s tree maps enable users to compare data across different levels of hierarchy, such as categories, regions or countries. You can also customize the size and color of rectangles to represent different metrics.
Bubble maps use circles or bubbles to represent different data points on a geographic map. The bubbles can be of different sizes, mapped to different measures — for example, sales volume or any other numerical value. Power BI bubble maps also allow for interactive exploration and drilling down into different geographic regions to get more detailed insights.
Filled maps use shading or tinting to display how a value differs in proportion across a geographic area or region. The intensity or shading of colors reflects the magnitude of the data, which allows users to visualize patterns and trends.
Check out how we delivered a Web3 Antivirus solution using ML and data analytics
Power BI data visualization: best practices and tips
To maximize the effectiveness of your Power BI data visualizations, we recommend you make use of the following best practices and tips:
Customize your visualizations
Power BI offers a multitude of customization and integration options that can improve your data visualizations. By customizing the colors and layouts of your visualizations as well as integrating them with external tools and services, you can create interactive dashboards that effectively communicate data insights to your audience. If necessary, you can also hide unwanted details or sensitive data in the visuals.
Make the most of ML-powered visualizations
Power BI leverages machine learning capabilities in some of its interactive visualizations, such as decomposition trees, anomaly detection, and smart narrative. For example, with decomposition trees you can facilitate root cause analysis, guiding users to drill down into specific data and pinpoint underlying causes. Anomaly detection can analyze time series data, such as line charts, to spot deviations. Smart narratives can help you quickly extract key takeaways and trends by providing auto-generated text to create compelling data stories for users. By deploying these ML-powered features you can empower your users to get deeper insights.
Optimize dashboards for your audience
When customizing your reports and dashboards, keep in mind your target audience. Ask yourself such questions as:
- How will they use the dashboard?
- What metrics will help them make informed decisions?
- What information does your audience need to be successful?
Tell a story on a single screen
To ensure an effective dashboard, it is recommended that you display all important information on a single screen to provide quick access to essential data. Make sure that your dashboard provides a seamless and streamlined user experience by removing unnecessary information and focusing only on the essential elements that convey key insights to your audience.
Emphasize the most important information
Be sure to prioritize the most critical information on your dashboard. For example, you can change its size and color or put the highest level of data at the top left corner, since this area typically gets more attention from viewers. You will then ensure that the most valuable insights are immediately visible.
Closing thoughts
Power BI offers cards, charts, tables, matrices, slicers, and other powerful data visualization techniques for unlocking valuable insights. Whether it’s analyzing trends, finding patterns, or making data-driven decisions, Power BI data visualization tools can help you harness the full potential of your business data.
If you’re looking to take your business data to the next level, consider partnering with PixelPlex data visualization experts. With 16 years of experience and a proven track record of 450+ successful client stories, PixelPlex offers comprehensive data analytics services.
Remember, data visualization is not just about presenting information, but also about telling a story and driving meaningful action. Thanks to Power BI and expert support from PixelPlex, you can make informed decisions and foster a data-driven business culture.
Leave us a note, and we’ll get back to you as soon as possible to discuss your idea.