
Stories that evoke emotions stay with us for a long time. We remember artwork that resonates deeply with our feelings. Applying storytelling to data helps businesses turn their dry statistics into captivating narratives that make the information more compelling and drive strategic insights.
Data storytelling has the potential to improve businesses’ decision-making. It turns the raw numbers into parts of a clear and well-structured narrative. When this process is supported with data visualization, it makes the effect even stronger.
In this article, we discuss the essential elements of data storytelling, its benefits for companies, and best practices. Let’s find out how to use data effectively and influence business results with it.
What is data storytelling?
Data storytelling is the process of transforming data and analysis into an engaging and easily understandable format for the audience. If you’ve ever watched TED Talks, you probably know what we mean here. Some of those short presentations are built on data and research. They use a logical structure, clear examples, and a humorous tone. In essence, it’s about weaving numbers into a compelling human story.
According to Deloitte, storytelling plays a critical role in luxury marketing, as it highlights experiences and values without simple enumeration of features. The same approach can enhance the communication of any complex idea. If a well-structured narration is supported with vivid data visualization, the audience understands the intention of the presenter and receives insights.

Marketing in the Metaverse: Best Practices and Key Strategies for Businesses

Top 10 Digital Transformation Trends for 2026 and Beyond
Struggling to extract meaningful insights from your business data? Contact our team of expert big data consultants and engineers for professional assistance
What are the benefits of data storytelling?
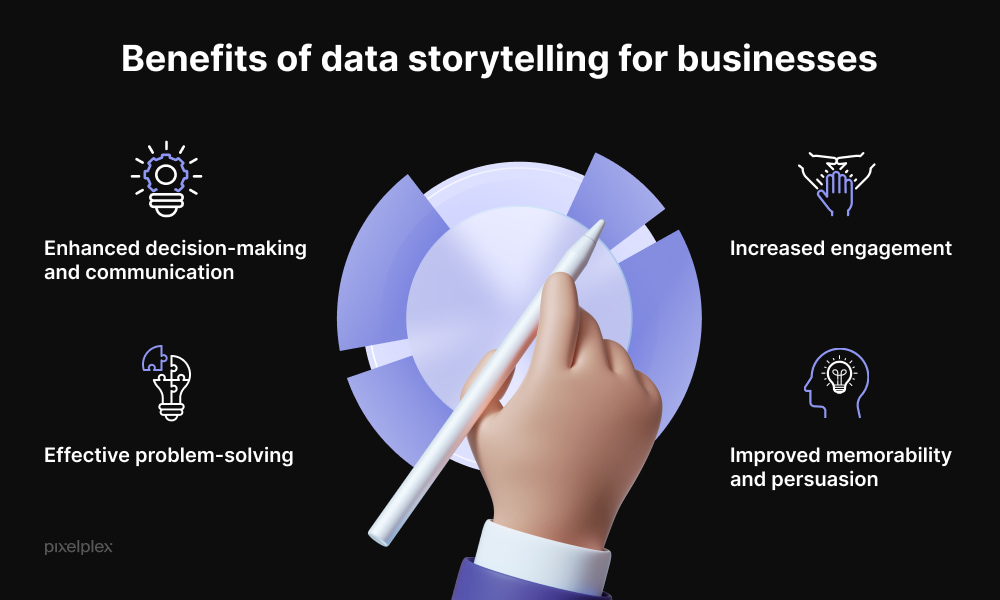
Data storytelling allows businesses to receive the following important advantages.
Improved decision-making and communication
The way you talk about something impacts the impression you make on your audience and may inspire them to change some processes or agree with your proposition. While telling a story, you transform complex datasets into digestible chunks. It helps listeners to grasp the idea and make well-informed decisions. Therefore, leaders may better motivate their teams, effectively convey important trends to stakeholders, and enhance communication.

When Do You Need IT Consultants for Your Project? A Guide on How to Choose the Right One

How to Boost Profits and Increase Client Loyalty with Customer Data Analytics: Complete Guide
Discover the fundamentals of data-driven decision-making and learn how to effectively implement this approach in your business
Increased engagement
A well-crafted story is one with a captivating introduction, logical coverage of the ideas, and a consistent conclusion. Such a structure more effectively captures and retains an audience’s attention. When the presenter supports the ideas with images and graphs, it provides the necessary context and stimulates an emotional attitude. This, in turn, leads to enhanced comprehension and recall and makes the information more impactful.
Effective problem-solving
A presenter may choose the data points that are critical to convey the main idea. In data storytelling, they describe these points in detail, drawing the audience’s attention. Therefore, listeners better see operational bottlenecks and more eagerly address those issues. Raw datasets, in contrast, are usually difficult to analyse at once and may seem misleading in setting priorities regarding the most urgent solutions.
Enhanced persuasion
Both an employee and a team lead are more likely to improve performance if they understand what they need to do and when they remember it. A narrative format of presenting important information makes it easier to memorize it. At the same time, when the audience can recall the data, they will think it over and become persuaded by its message.

Electronic Document and Content Management Systems in Enterprises: Features, Benefits, and Software Examples

A Detailed Guide to Data Discovery Processes, Tools, and Best Practices
Stay ahead of the curve! Explore the top 15 business intelligence trends of 2026 and beyond to keep your business at the forefront of innovation
How to tell a story with data?
Effective data storytelling combines technical data analysis with narrative techniques.
First, it is important to dive into data analytics, as presenters should know and operate patterns, trends, and insights. Data analytics includes tools and methodologies like data mining, statistical analysis, and predictive modeling to examine large datasets, generate insights, and further use them while telling a story.
Then, the presenter should emphasize these technical findings through a well-crafted narration. The final story must align with business objectives and resonate with the target audience. An effective presentation follows a logical structure, contains critical facts, supports strategic decisions, and drives action.
We summarized the main components of a well-structured data storytelling in this table:
| Component | Key benefit | Description |
| Narrative structure | Increased engagement | Uses a compelling story line to capture and hold the audience’s attention |
| Data visualization | Enhanced comprehension | Employs visuals to provide context, trigger emotion, and improve recall |
| Data analysis | Effective problem-solving | Identifies critical insights and patterns to clarify issues and guide solutions |
| Audience alignment | Improved decision-making | Translates complex data into relevant insights for clear communication and action |
| Memorable format | Enhanced persuasion | Makes information easier to remember and reflect on, increasing its persuasive power |

Choosing the Right Font and Its Presentation: A Key to ADA Accessible Websites
Not just data storytelling: empower your solution with our expert business intelligence services to unlock deeper insights and drive impactful decisions
The importance of visualization in data storytelling
Data visualization is the process of supporting your presentation with visual aids, such as charts, graphs, images, and infographics. These means help the audience to better understand the message, focus on important trends and patterns, and make logical conclusions.
Data visualization simplifies decision-making and boosts the implementation of required steps or strategies, as stakeholders can immediately see and get the implications of the data. Graphs and charts also ensure consistent interpretation of data across diverse teams, as they see the same information and align their workflow with the insights.
Dive into our detailed guide showcasing the 10 best data visualization tools of 2026
Top 10 strategies for effective storytelling with data visualization

Now, let’s see how you can improve your storytelling strategy with the means of data visualization. You will require a blend of technical skill and creative strategy.
1. Clarity and simplicity in design
The main aim of data storytelling is to explain complex information simply. Visual data helps to achieve it by focusing on key data points. While presenting the report, a speaker shows certain statistics on various types of graphs to emphasize its importance to the audience. For example, a line chart is suitable for showing trends over time, and a bar chart is ideal for comparing categories.
Experience our expert UX/UI design services that uniquely present data and perfectly articulate your brand's voice
2. Use of color for emphasis and differentiation
A color palette of the presentation also serves several aims. First, it demonstrates the style and translates brand identity. Second, it guides the viewer’s eye to key information. For instance, contrasting colors highlight differences, while harmonious colors indicate relatedness. The key lies in balancing appealing hues with their functional ability to bring the audience to the required decision or conclusion.
3. Narrative and consistent structure
Any story that grabs listeners’ attention should have a catchy introduction, a logical main part, and a conclusion with a message. The same approach works with visual data.
If we talk about slides, the first one usually states the name of the presenter, the topic, and some general context. It helps the audience anticipate what is going to follow. The middle part of the presentation demonstrates the main insights and trends. The final part should offer conclusions or actionable insights. This structure allows for a better understanding of the message and gives the impression of productive and completed work.
4. Interactivity for greater engagement
Interactive elements in data visualizations provide a dynamic experience and make the audience feel engaged. Viewers may interact with the data, such as through filters, sliders, or clickable elements. Therefore, they can explore the aspects that interest them the most. This allows viewers to discover their own insights and offers some personalization. For example, different team members may be interested in different data details, so they will focus on their own targets.
5. Consistency in style and formatting
The choice of fonts and typographic elements influences the viewers’ subconscious and may even affect their thoughts and feelings. This is called font psychology. Fonts add to the general style of the presentation and deliver the brand identity just like a color palette. At the same time, fonts should align with your business philosophy and target audience. For example, bold fonts add weight to the ideas, and a serious tone of the presentation demands structured letterforms and enough spaces to make the readability higher. The knowledge of design principles allows for maintaining the right flow of the presentation and better audience attention on the content.
6. Usage of analogies and metaphors
Analogies and metaphors help to better imagine complex concepts. For example, comparing sales growth to climbing a mountain can help the audience visualize the effort and progress. Such figures of speech add creativity to your data storytelling and make the perception easier and more pleasant.
7. Targeted audience analysis
Means of data visualization should adapt to your audience’s background and needs. For example, experts in a certain field often require detailed, technical visualizations. A more general audience might benefit from simplified examples. Tailor the complexity and depth of data presentations to the audience to make sure your message reaches them effectively.
8. Uniform data sourcing and credibility
Add credibility to your data visualization by referring to reliable and expert sources. Use proper in-text citation to allow your listeners to explore the data further if they wish. Quotes of well-known businessmen and customer testimonials also add credibility to the presentation. However, they should be real, fakes may drastically undermine the reputation.
PixelPlex offers a comprehensive range of data analytics services tailored to specific needs. Explore our offerings to find the perfect solution for your organization
9. Balanced data representation
Be objective in assessing data and presenting facts. Carefully select the information from reliable sources to avoid any bias or misrepresentation. Overemphasis or underrepresentation of certain data points might lead to misleading conclusions.
10. Contextual relevance and timeliness
The audience is more likely to listen to you attentively if you make your presentation and data visualization relevant to the current events or industry trends. Adding charts on timely topics or even popular memes makes the data more compelling and meaningful to the audience. To achieve this, you should stay informed of the most current news and monitor trends to remain relevant to the audience.
Here’s the table summarizing the key elements of a well-structured storytelling with data visualization:
| Element / Component | Primary impact on audience |
| Charts/graphs | Simplify complex data, emphasize key points, aid memory and persuasion |
| Color palette | Guides the viewer’s eye, highlights differences or relationships, conveys brand identity, influences decisions |
| Narrative structure (introduction, main part, conclusion) | Improves understanding, creates a sense of completion, maintains attention |
| Interactive elements (filters, sliders, clickable parts) | Increase engagement, allow personalized exploration, support self-driven insight discovery |
| Typography & fonts | Influence subconscious perception, show brand identity, affect readability and tone |
| Analogies & metaphors | Make abstract or complex concepts easier to visualize and relate to, add creativity |
| Sources & citations | Build trust, allow verification, enhance authority |
| Current events, trends, memes | Increase attention, make data more compelling and meaningful |
How PixelPlex can help
Storytelling with data allows businesses to deliver critical ideas and make well-informed decisions regarding workflows, optimization processes, and other important areas. Adding data visualization enables effective communication both inside organizations and with external partners.
PixelPlex is ready to offer our data visualization services to make your data speak. Our experts provide data visualization consulting, design, implementation, and maintenance. We specialize in Power BI and Tableau consulting.
Contact us to share your vision and explore how we can help.