
Power BI and Tableau offer powerful solutions for optimizing business intelligence. However, understanding the distinctions of these tools is essential for extracting the maximum value from your data. So, the question remains: Power BI or Tableau?
A robust decision-making process strikes a balance between decisiveness and due diligence. In today’s era of vast data influx, the ability to swiftly convey information and extract useful insights holds significant importance in every business context.
Business intelligence (BI) platforms play a critical role in helping businesses effectively analyze, manipulate, and visually present complex data. In this realm, Power BI and Tableau stand out as prominent players.
Read on to explore the key features, products, benefits, and limitations of both platforms, and see what differences they have.
Introducing two leading business intelligence tools: Power BI and Tableau
BI tools have the potential to uncover untapped opportunities for companies, enhance their return on investment (ROI), and help them gain a competitive advantage. They do this through data mining, visualization, predictive analytics, and reporting capabilities. These tools seamlessly harness a wide array of data sources, including docs, photos, emails, videos, and other formats.
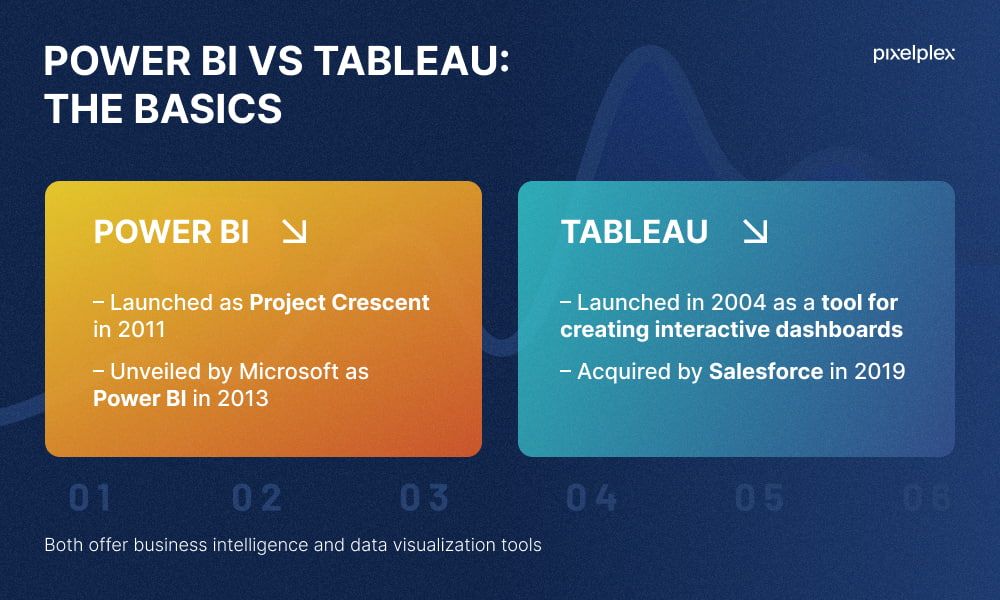
In 2011, Microsoft introduced Power BI (Project Crescent at that time), driven by their vision to create a user-friendly interface that empowers non-programmers to efficiently organize and visualize data. This approach instantly resonated with numerous companies, making Power BI an immensely attractive solution.
Today, Power BI is a versatile cloud-based toolbox used by business intelligence consulting experts and data analytics services providers. It allows for creating data visualizations that are accessible through a web browser, mobile device, or desktop app. Power BI seamlessly integrates with Microsoft tools like Excel and SharePoint.
Tableau, on the other hand, is a set of data analysis tools that supports data sources such as PDF, Box, Google Analytics, Excel, and many more. Tableau was launched in 2004 and acquired by Salesforce 15 years later.
Want to find out how to incorporate the latest tech such as data analytics, AI, or blockchain into your project? Turn to our seasoned IT consultants
Tableau vs Power BI: what are the similarities?
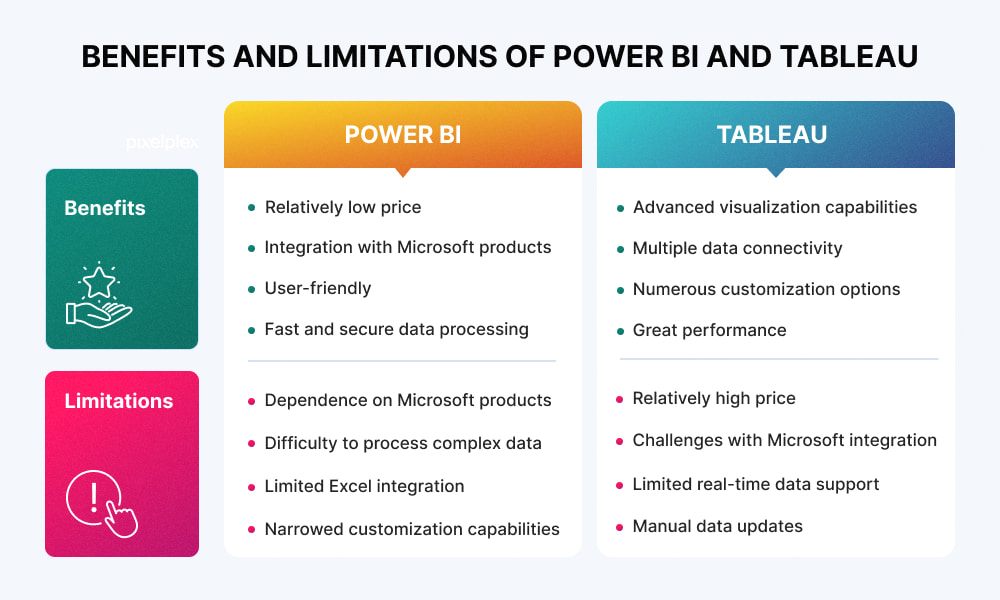
Tableau and Power BI are the two most widely used BI tools, and their similarities in terms of features and functionality extend to other aspects as well. They both create dashboards to display data visualizations, and also, very importantly, they are both no-code tools. Let’s take a closer look.
They are the two most widely used BI tools
According to research published by Gartner, both Tableau and Power BI were named Leaders in the 2023 Gartner Magic Quadrant for Analytics and BI Platforms. Power BI slightly outranks Tableau, which has 4.3 stars out of 5 from over 2100 ratings, with an average 4.4-star rating from over 2500 reviews.
Accordingly, Tableau has a market share of 17.02%, with 68,435 companies using it, whereas Power BI has a market share of 16.80%, with 68,062 user companies.
They both create and display data visualizations
Both Tableau and Power BI can be used to create dashboards and reports to display data visualizations and help companies extract valuable insights.
Tableau has gained recognition for its ability to produce visually stunning dashboards, enabling users to effortlessly build them through a drag-and-drop interface. Power BI, on the other hand, employs tiles and dynamic visualized metrics directly connected to reports and datasets.
Overall, both platforms allow for easy and effective interaction with the created business data visualizations.
They are both no-code tools
Neither platform requires coding. Arguably, users with experience in Excel will be able to adapt more quickly to Power BI. Tableau can also be utilized by non-technical users, but there is something to take into account: while exploring pre-built visualizations is easy for individuals from various technical backgrounds, in-depth analysis does require a certain level of technical experience.
Read our article to learn about Tableau data analytics and its business applications in greater detail
Power BI vs Tableau: what are the differences?
Power BI and Tableau differ in many aspects, such as price, licensing, programming languages, user interfaces, data capacity, and performance. Let’s take a look at each of these parameters to really pull them apart.
| Power BI | Tableau | |
| Price | The Pro plan is $9.99 per month | The Creator Tableau plan costs $70 per month |
| Licensing | No license keys required | License keys are required |
| Programming languages | Data Analysis Expression and M — for data manipulation and modeling; R — for enterprise users | C, C++, Java, and Python |
| User interface | Intuitive and easy to use, preferred tool by businesses opting for simplicity | Used for customized dashboards and enables data experimentation and smart results |
| Data integration | Supports multiple data sources but has fewer databases and servers than Tableau | Can connect to a wider range of data sources, including cloud-based databases and web services |
| Data visualization | Has a more user-friendly interface for dashboard visualization | Has more advanced visualization capabilities and charting options |
| Data capacity | Can handle only 10 GB of data | Can handle a large amount of data: Tableau Cloud has a storage capacity of up to 100 GB |
| Customization options | Some limitations in terms of options | Has more advanced customization options |
| Collaboration features | Has more built-in collaboration features | Has more robust collaboration features |
| Performance | Can handle a limited volume of data | Can handle a huge volume of data and provide a 360-degree view of your data without size restrictions |
| Deployment | On Cloud; On-premise; Windows | On Cloud; On-premise; Linux, Mac, Windows |
| Ease of use | User interface, based on Microsoft Office 365, is familiar to most end-users, making it easier to use | Incorporates natural language capabilities into its software |
| Suitability | Small and medium enterprises | Large enterprises |
| Customer support and community | Microsoft Power BI is a relatively small community | Tableau has a large and active online community |
Price
Power BI is more affordable: it offers a free version and lower-cost paid options. The Power BI Pro version costs $9.99 a month per user, and Power BI Premium costs $20 monthly. However, there is the Power BI Premium per-capacity version starting from $4,995.
Tableau, on the other hand, is a bit more costly, especially for enterprise-level solutions. The basic Creator bundle starts at $70 per month per user.
Licensing
Licenses for Power BI Pro or the Premium per-user version are free. The level of access their license provides depends on whether the workspace is Premium or not.
As for Tableau, each user who accesses resources on Tableau Server must be licensed.
Programming languages
Power BI supports Data Analysis Expression and the M language for data manipulation and modeling. Microsoft Revolution Analytics connects to R, but only enterprise users can do this. Tableau integrates with R better than Power BI. The Tableau Software Development Kit supports C, C++, Java, and Python.
User interface
The user interface is similar to other Microsoft products, and is intuitive. Power BI Desktop provides three views to select on the left side of the canvas: the report view, the data view, and the model view.
Tableau’s intelligent interface allows you to customize your dashboards. Its workspace invites data experimentation and smart results. The workspace contains cards, shelves, a toolbar, a sidebar, a data source page, a status bar, and sheet tabs.
Data integration
Power BI has limited access to other databases and servers compared to Tableau. Microsoft Excel, text/CSV, MS SQL Server, Access DB, Oracle, IBM DB2, MySQL database, and PostgreSQL database are some examples. In such scenarios, big data consulting services can help organizations design efficient data pipelines and integrations to maximize the value of available sources.
Conversely, Tableau has access to numerous database sources and servers, including Excel, text files, PDF, Amazon Redshift, Google Analytics, Dropbox, Google Sheets, and Google Drive.
Data visualization
Power BI focuses on allowing users to access, analyze, and share data quickly and easily. Its dashboards display various tables and charts to illustrate the key data points.
Tableau is known for its data visualization capabilities and has more advanced charting options. It also offers an intuitive experience, with a patented engine that supports its drag-and-drop interface. Visualizations are built on separate sheets and can be combined onto a dashboard for interactive data visualizations.
Data analytics vs data science vs big data: what’s the difference? Read on to find out
Data capacity
Power BI can handle only 10 GB of data. Anything more than that requires cloud services like Azure.
Tableau Cloud, on the other hand, has a storage capacity of up to 100 GB, and Tableau has a columnar-based structure, which stores unique values for each column, making it possible to fetch even billions of rows.
Customization options
Tableau has more advanced customization options than Power BI. Tableau users specifically value the tool’s capacity to customize and tweak charts, add calculated fields and formulas, and create interactive dashboards.
Collaboration features
Power BI has built-in collaboration features such as co-authoring and commenting, but is more focused on individual user analysis.
Tableau allows for wider collaboration. This includes creating and sharing interactive dashboards with other users, while third-party tools enable even more collaboration features.
Performance
Power BI and Tableau both aim to handle large amounts of data at speed by using various types of storage and connections. Tableau performs better than Power BI with significantly larger data sets, while Power BI is faster when data sets are more limited.
Deployment
Even though Power BI has both on-premises and cloud versions, it is limited to Azure in the cloud. When considering deployment flexibility, Tableau comes first, since it has more cloud-based and on-premises options. When massive amounts of data are stored in the cloud, Tableau performs significantly better.
Ease of use
Power BI’s user interface, based on Microsoft Office 365, is familiar to most end-users, making it easier to use.
Tableau also incorporates natural language capabilities into its software. This allows users to interact with the platform using natural language queries, making navigation and exploration of data user-friendly and intuitive.
Usability
As mentioned above, Tableau can handle large datasets and is best known for its attractive data visualizations, making it more suitable for medium and large enterprises. Power BI is a better fit for small and medium enterprises due to its usability and price.
Customer support and community
Tableau has an active community of more than 160,000 users. There’s a large community forum and over 500 global user groups. Tableau also hosts conferences worldwide along with virtual events like the Tableau Live discussion panels.
Microsoft Power BI is much “younger” than Tableau, and therefore has a smaller community. However, it is actively working to change that by hosting annual Power BI Summits that include over 100 sessions.
What are the benefits and limitations of Power BI and Tableau?
To engage in the Power BI vs Tableau argument more thoroughly, we need to examine further the strengths and limitations of both platforms. Let’s find out more.
Power BI benefits
- Relatively low price: Power BI offers affordable pricing options for $10 per month. It also offers a free version and a low-cost subscription plan suitable for small businesses. If users purchase the Power BI Pro plan, they can enjoy the whole range of Power BI components and Microsoft Services, for example, Cortana for voice queries.
- Integration with Microsoft products: Power BI can easily integrate with other Microsoft products like Excel, SharePoint, and SQL Server. Updates for Microsoft’s software are provided for Power BI features as well.
- User-friendly: Power BI offers a user-friendly learning experience with an interface resembling MS Excel. It supports the DAX query language, enabling users to execute queries on datasets using natural language.
- Fast and secure data processing: Its fast data processing is a powerful feature as it helps users quickly get insights from their data without compromising security. With Power BI, you can establish a secure connection to your data sources, whether they are stored in the cloud or on-premises.
Learn more about how you can effectively visualize data with Power BI
Power BI limitations
- Dependence on Microsoft products: While being advantageous in many aspects, it can also be a limitation. For instance, the Power BI desktop version lacks compatibility with iOS.
- Difficulty to process complex data: When dealing with large datasets that involve complex features, it is often required to generate distinct data models with custom fields to facilitate table joining, which can be quite difficult.
- Limited Excel integration: Excel integration is a competitive feature, no doubt, but only data of up to 150,000 rows can be downloaded, which can be constraining at times. Moreover, it does not accept files bigger than 1GB, which can be a problem for companies needing to process large volumes of data.
- Narrowed customization capabilities: While Power BI offers a range of customization options, providing different levels of flexibility, its visualizations have limited configuration options.
Tableau benefits
- Advanced visualization capabilities: Tableau offers a wide range of charts and graphs, making it easy to explore and communicate data.
- Multiple data connectivity: Tableau can connect with more data sources than Power BI, allowing its users certain levels of flexibility. This improves the quality of data analysis and outcomes, ultimately leading to better decision-making.
- Numerous customization options: Tableau offers a high level of customization by allowing its users to adapt the appearance and functionality of their reports and dashboards to their own requirements.
- Great performance: Tableau uses languages like Python and R for sophisticated spreadsheet calculations, thus avoiding performance issues. It also operates faster and more efficiently on big datasets. Tableau’s high performance gives it an edge over other data analytics toolkits.
Tableau limitations
- Relatively high price: Compared to BI giants like IBM and Oracle, Tableau may not seem very expensive. However, the license costs can burden small and medium-sized businesses, and even larger enterprises that require several licenses or advanced capabilities.
- Challenges with Microsoft integration: Microsoft offers many BI solutions that are used by a wide variety of organizations, like Power BI. However, Tableau’s integration with products like Dynamics 365, Microsoft Flow, and Office 365 is complicated due to the single sign-on process.
- Limited real-time data support: Tableau’s effectiveness in handling real-time or streaming data sources may be relatively lower when compared to other solutions designed specifically for real-time data processing.
- Manual data updates: Tableau does not offer an automatic option for refreshing reports, which means that every time there are changes in the data, it must be manually updated in the backend.
Power BI or Tableau: which one to choose?
Still undecided about where you stand on the Power BI vs Tableau debate? The good thing is that you don’t need to choose. Making the right choice mostly depends on your business requirements.
Power BI can work with multiple data points and is a more user-friendly and affordable option, especially for smaller start-ups or mid-size firms with limited resources. It comes, nevertheless, with fewer advanced features when compared to Tableau.
Tableau has powerful and flexible visualizations and can handle large datasets. But it comes with a higher price and a steeper learning curve, and is therefore better suited for medium and large enterprises with bigger budgets and detailed analytical needs.
Are you ready to start developing your own software aligned with your business needs? We are here to help
Final thoughts
When comparing Power BI and Tableau, both emerge as excellent tools for business intelligence and data visualization. If you need a partner when you embark on your data exploration and visualization journey, PixelPlex is here to collaborate with you.
Our data visualization services actually go beyond these capabilities: we offer a comprehensive solution to fuel your business strategies with data-driven insights that bring value across your enterprise.
From customizing data strategies to integrating intelligent techniques and deploying in the cloud, PixelPlex has you covered. Our expertise includes deploying targeted big data software, specifying hardware, and implementing interfaces for external endpoints.
Reach out to us and unlock the full potential of your business data!